Product guide
Projects
Projects give every venture-clienting initiative its own workspace — structured, tracked, and visible across your team. This page covers how the pipeline is organized, what’s on a project page, and how to configure all of it for your organization. Every section below can be expanded or collapsed.
Groups and phases
Every project sits in exactly one phase at a time, and every phase belongs to one group — together, these are what drive the Kanban board, a project’s Timeline, and every pipeline chart in Analytics.
- A group is one of the broad stages of the pipeline — Ideas, Discovery, PoCs, or Implementations.
- A phase is the more granular step inside a group — e.g. Sourcing or Assessment inside Discovery — used to track progress in detail and to drive which tasks a project needs next.
These are GlassDollar’s default process, built from what’s powered 1,000+ PoCs on the platform:
| Group | Phases |
|---|---|
| Ideas | Requests → Backlog |
| Discovery | Sourcing → Assessment |
| PoCs | PoC Planning → PoC Execution → PoC Success / PoC Fail |
| Implementations | Implementation → Implemented → Scaling → Scaling Completed |
Every group and phase label can be renamed for your organization, and the tasks inside each phase can be reshaped per Project Type — see Group Labels, Phase Labels, and Project Types below.
The project page, section by section
Open any project and it reads top to bottom in the same order, whatever its Project Type: a Timeline, the project’s general details, its Pain Point, the Solution(s) being evaluated, the Business Case, and its Learnings.
1. Timeline

The Timeline is the project’s stepper — one bubble per phase, drawn from the project’s Project Type and your organization’s Group and Phase Labels (see Default settings, below). The current phase is highlighted; each bubble shows how many tasks sit in that phase and how much of it is done, and View tasks expands the checklist. Tasks — and who owns and approves each one — are defined per Project Type in Settings → Projects → Project Types.
2. General project details
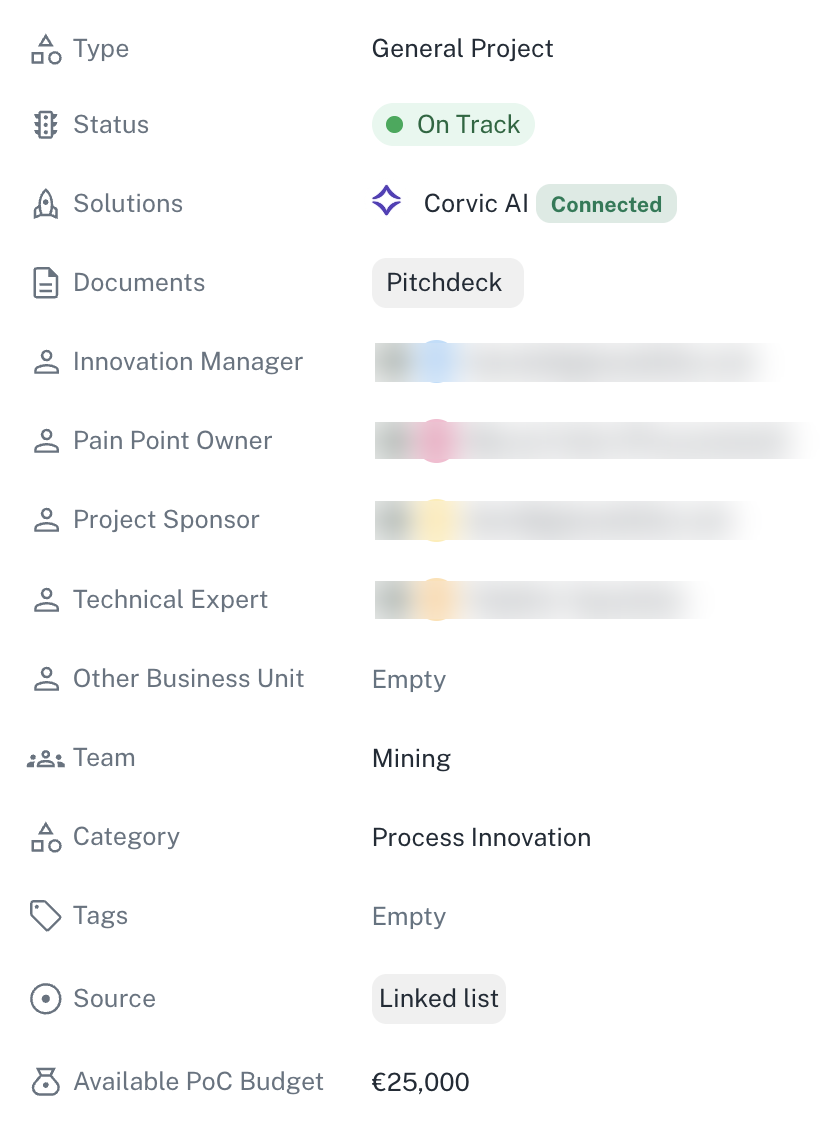
| Field | What it is |
|---|---|
| Type | The Project Type governing this project’s Timeline, tasks, and terminology |
| Status | The project’s Health Status (🟢/🟡/🔴) — automatic or manual, depending on your organization’s Health Status mode |
| Solutions | Companies linked to this project from a List or SourceAI |
| Documents | Files attached to the project (pitch decks, contracts, and similar) |
| Innovation Manager | The GlassDollar-side owner driving the project |
| Pain Point Owner | The business-side stakeholder who owns the underlying need |
| Project Sponsor | The executive sponsoring the initiative |
| Technical Expert | The subject-matter expert validating feasibility |
| Other Business Unit | A second Business Unit tagged on the project, for initiatives spanning more than one BU |
| Team | The department/team the project rolls up to — used for team-level breakdowns in Analytics |
| Category | Classifies the project as Process Innovation or Product Innovation — a fixed choice, not a free-text field — used for category breakdowns in Analytics |
| Tags | Free-form labels for filtering and reporting |
| Source | How the project originated — e.g. from a linked List |
| Available PoC Budget | The budget ceiling for this project’s PoC — feeds the Business Case and Financial Analytics |
3. Pain Point
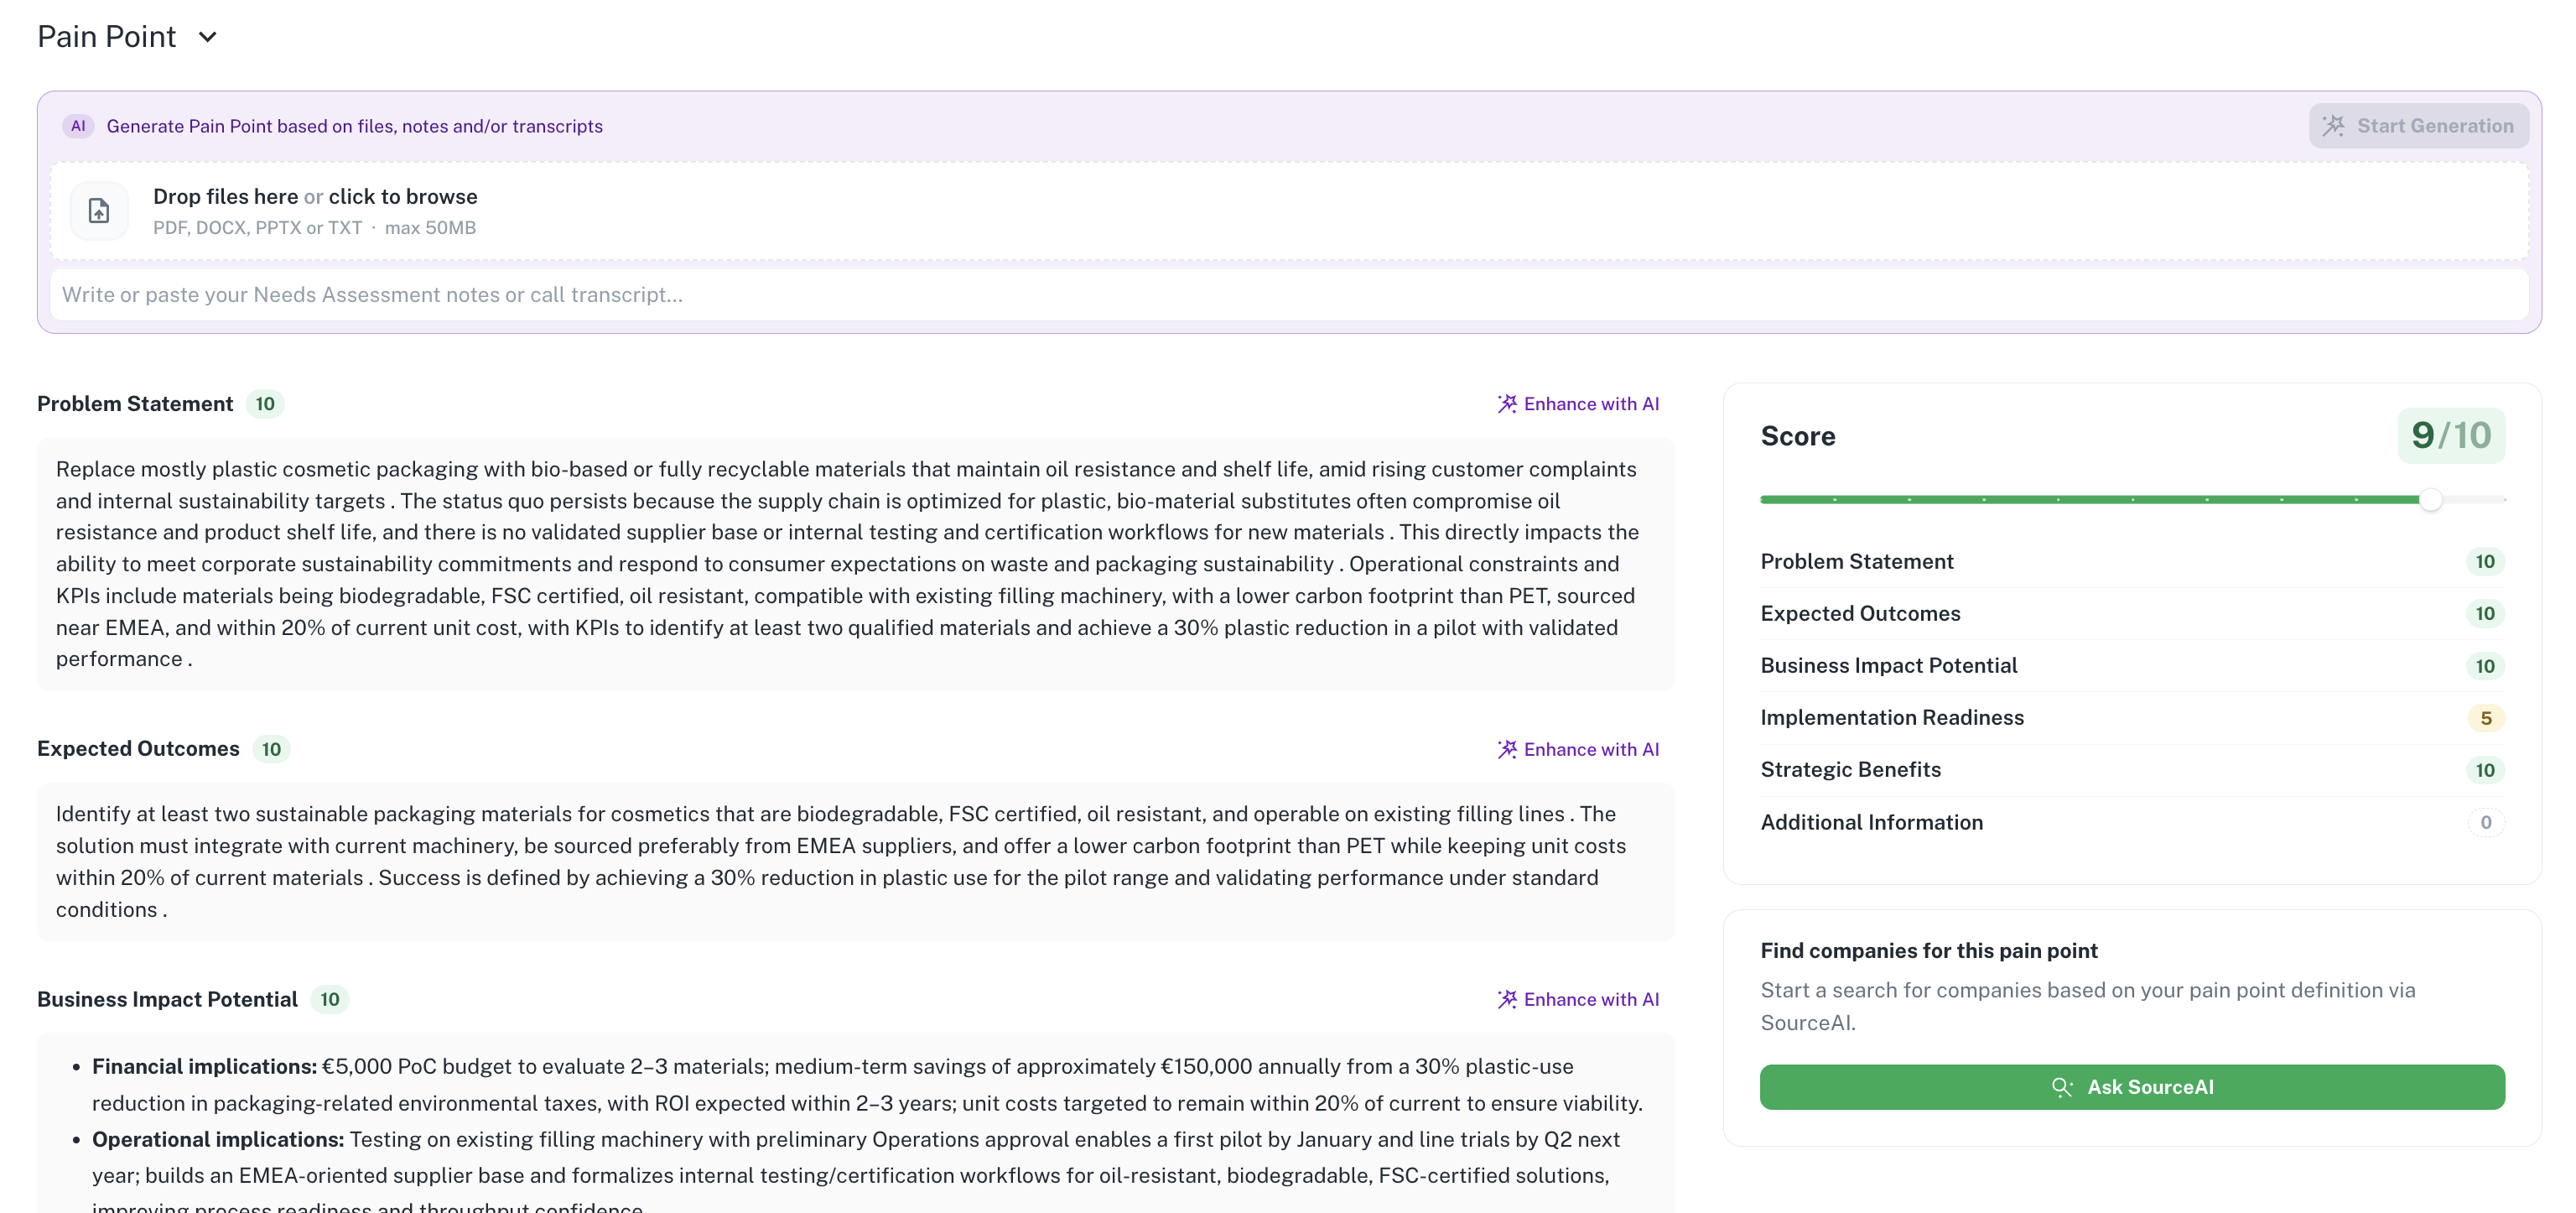
Drop in files, call notes, or a transcript and Start Generation drafts the pain point for you — or write it by hand. Each field carries its own Enhance with AI action, and the panel on the right shows a live, per-field Score.
This example project scores 9/10 overall — the average of Problem Statement (10), Expected Outcomes (10), Business Impact Potential (10), Implementation Readiness (5), and Strategic Benefits (10). Additional Information shows 0 because it’s never scored, and it isn’t counted in that average either. Full breakdown of how this is calculated: Settings → Projects → Pain Point AI.
Once the pain point is filled in, Find companies for this pain point → Ask SourceAI hands the same problem statement straight into a startup search.
4. Solution
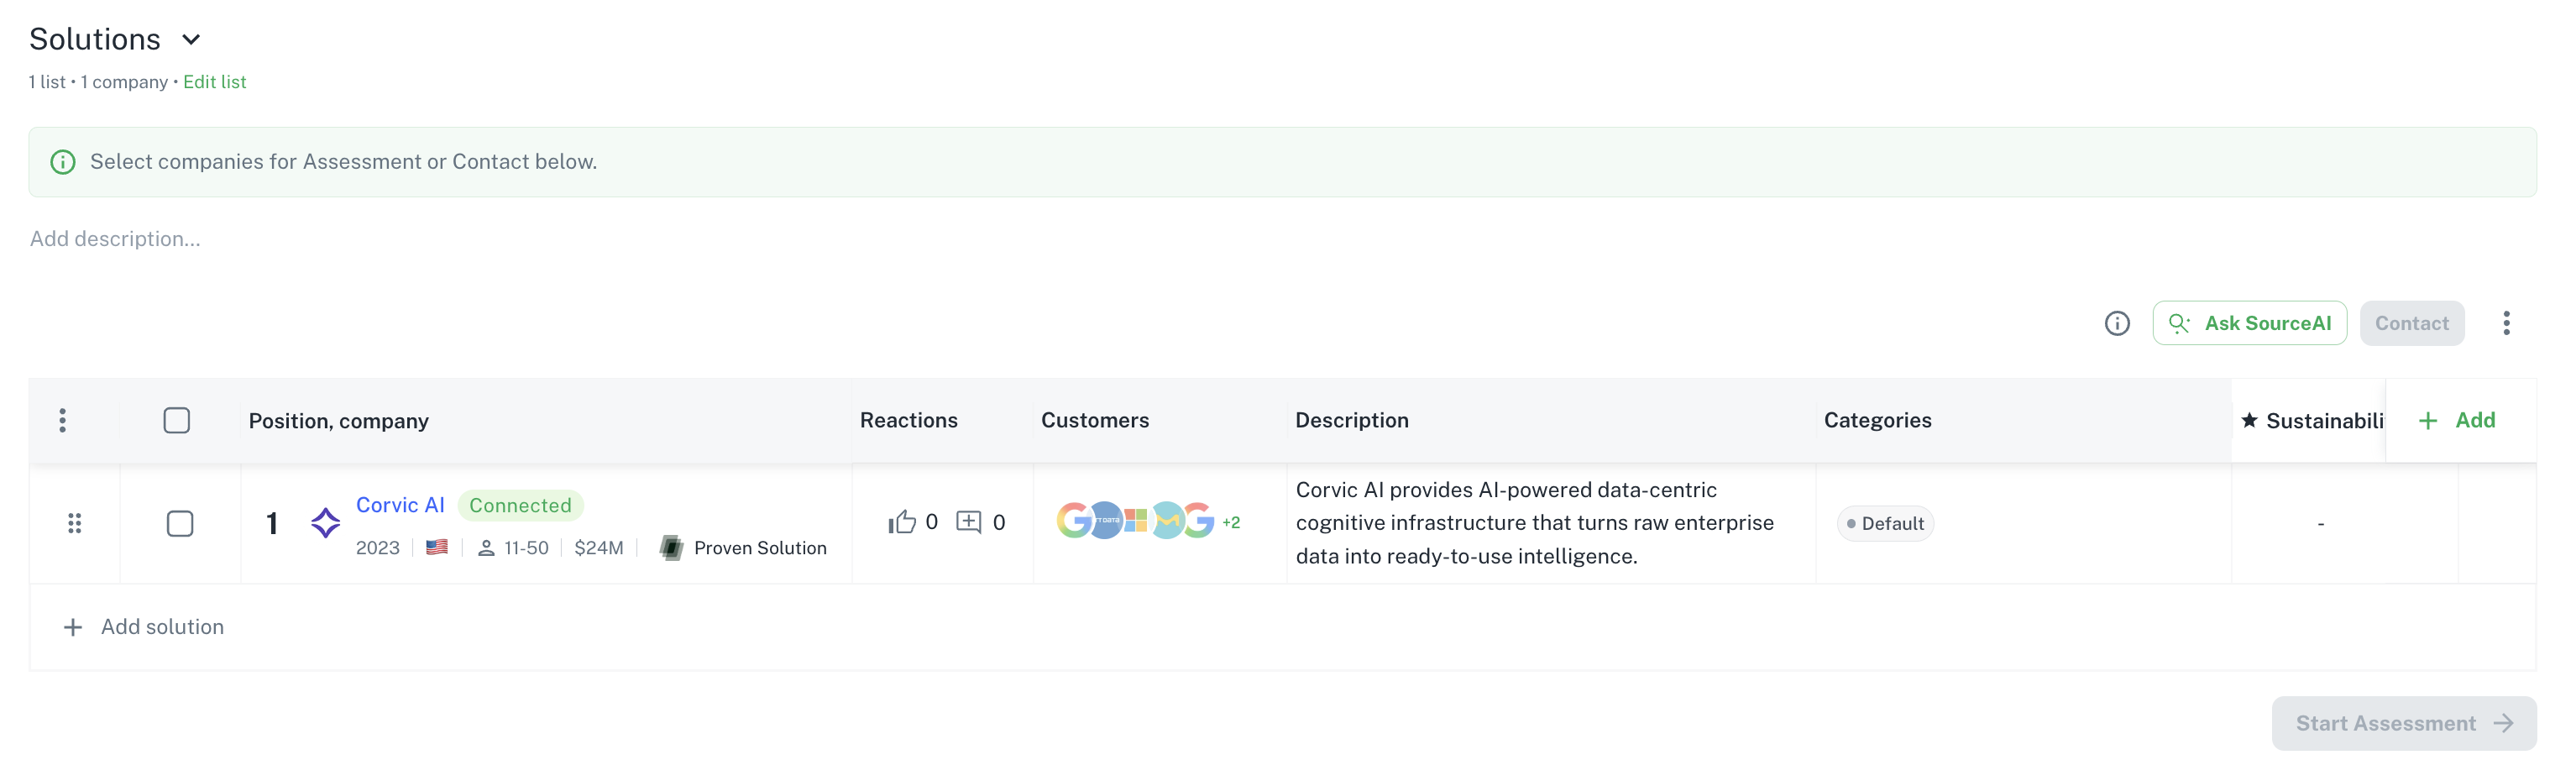
Companies shortlisted for this project, pulled in from a linked List or added directly. Select one or more to Start Assessment or Contact, and Ask SourceAI to keep searching against the same pain point without leaving the project.
5. Business Case
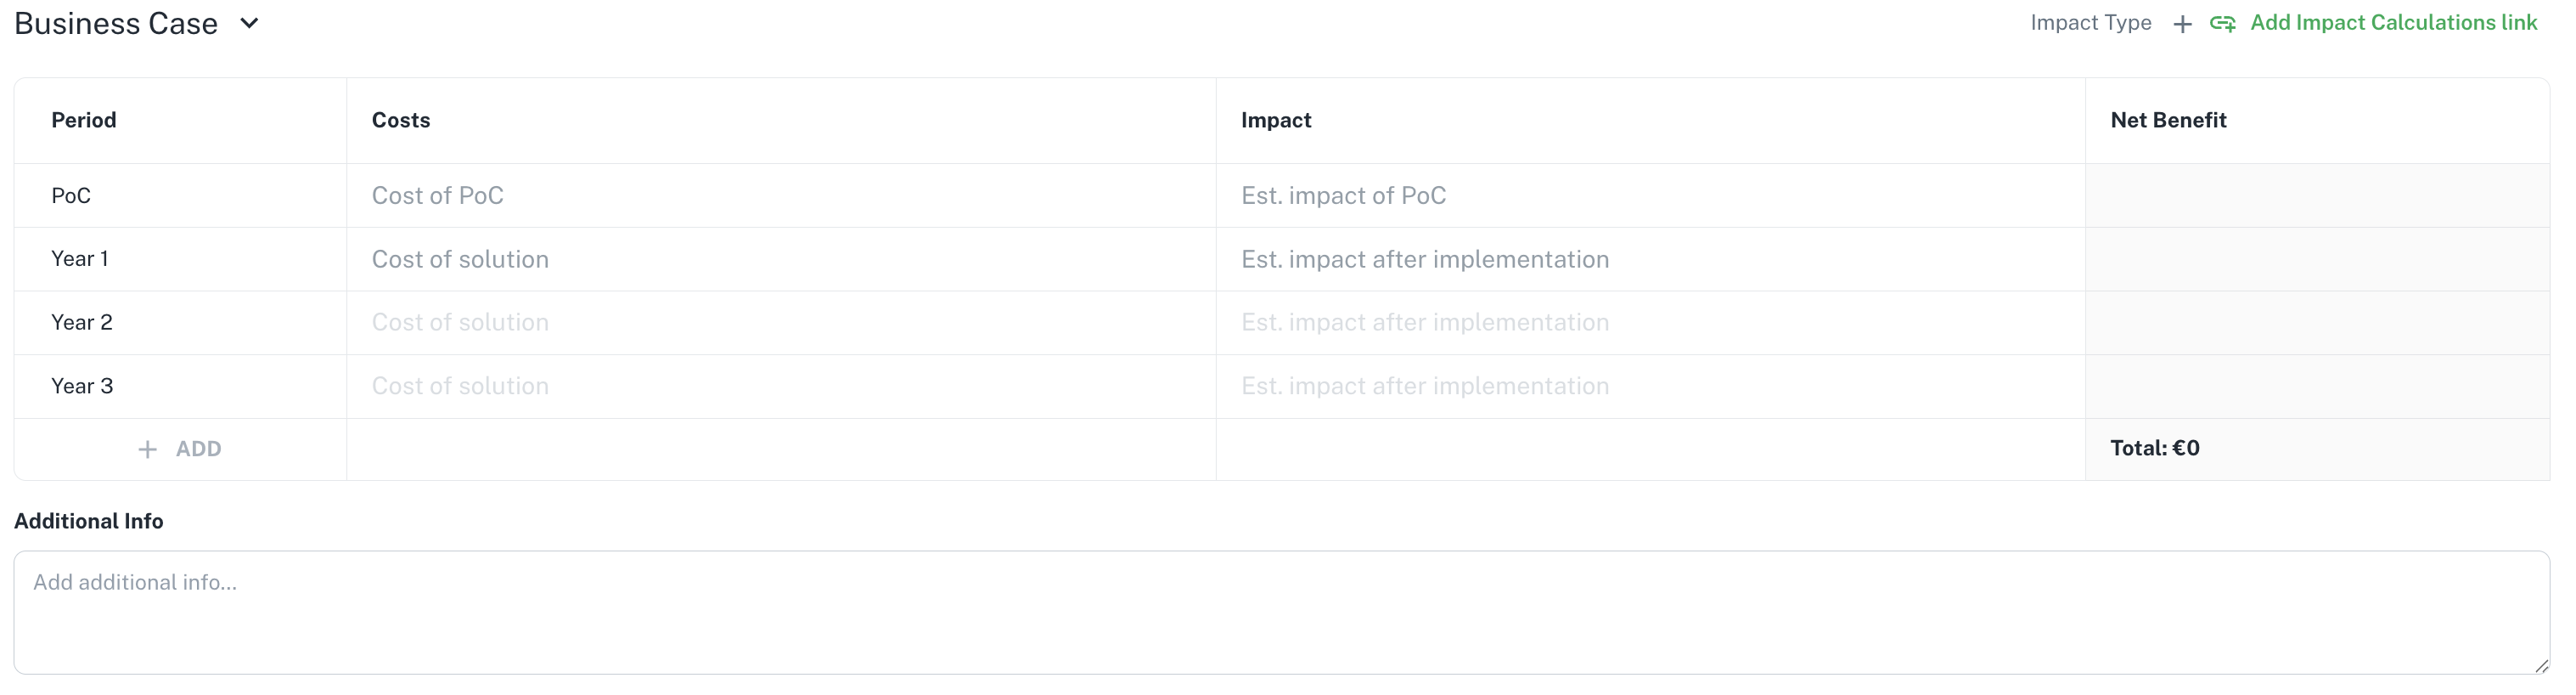
The financial model for the project — cost and expected impact for the PoC itself, then Year 1 through Year 3 of running the solution, netting out to a Net Benefit per period and a running total. Add Impact Calculations link attaches a supporting model, and Additional Info holds any assumptions or caveats.
This is the entry point for correct numbers in Analytics → Financial. That tab is built entirely from what’s entered here, project by project — an empty or partial Business Case is exactly what shows up as a Financial gap in Analytics → Data Health.
6. Learnings

A free-text field for the qualitative takeaway — what was actually learned, independent of the score or the outcome. It can be written at two levels: about this specific project (what this PoC, this solution, this team learned), or about the underlying pain point / process more broadly, so the insight survives even if this particular solution doesn’t move forward. Either way, it’s aggregated in Analytics → Learnings, currently filtered to projects at PoC stage or later.
Default settings (Settings → Projects)
Everything above — group and phase names, how health is calculated, and how the Pain Point AI scores what’s written — is configured once, for the whole organization, in Settings → Projects. GlassDollar’s own process, from 1,000+ PoCs, is the default; all of it can be renamed or recalibrated.
Project Types
A Project Type is a named, end-to-end workflow — the phases a project moves through, the tasks and approvals required at each one, and the terminology used to describe it. GlassDollar’s default playbook is the starting point for every organization; reshape it, or add new Project Types for how different parts of your business actually work (e.g. Software Procurement vs. Hardware Integration), so a quick evaluation and a multi-year integration no longer share one rigid path.
| You can | Detail |
|---|---|
| Create Project Types | Define named workflows that match how different teams work |
| Rename everywhere | Renaming phases and groups (Group Labels, Phase Labels — below) carries through the Kanban, Timeline, Analytics, notes, cards, and lists |
| Define tasks per phase | Ordered tasks per phase, each with an owner, approver, due date, and documents — generated automatically as soon as a project is created |
| Assign owners & approvers | Work passes through a proper approval gate, and every transition is tracked |
| Attach templates & documents | The right reference material is available exactly when someone needs it |
| Notify the right people | Assignees and approvers are notified on assignment, due dates, and approve/reject decisions |
| Surface on Home | Each person’s assigned tasks show on their Home screen, across all projects |
Group Labels
A group is one of the broad pipeline stages a project moves through — Ideas, Leads, PoCs, or Implementations — used to organize the Kanban board and navigation.
These labels are visible to everyone in your organization. Any Innovation Lead can update them.
| Default group | Label |
|---|---|
| Ideas | Ideas |
| Leads | Discovery |
| PoCs | PoCs |
| Implementations | Implementations |
Each group keeps its colour indicator wherever it appears. Rename a group from this table, or click the revert icon to restore its default name.
Phase Labels
A phase is a more granular step within a group — for example, Sourcing or Assessment within Discovery — used to track a project’s progress in detail.
These labels are visible to everyone in your organization. Any Innovation Lead can update them.
| Group | Phases |
|---|---|
| Ideas | Requests, Backlog |
| Discovery | Sourcing, Assessment |
| PoCs | PoC Planning, PoC Execution, PoC Success, PoC Fail |
| Implementations | Implementation, Implemented, Scaling, Scaling Completed |
⚠️ Due to backend limitations tied to accurate analytics, it is currently not possible to add or remove groups or phases — only rename them.
Health Status
Automatically surfaces stalling projects — this is what powers the Status field on every project (General project details, above) and the 🟢/🟡/🔴 dot across the Kanban. Choose one of three modes:
| Mode | How it works |
|---|---|
| Automatic | Default thresholds apply: 🟢 active in last 10.5 days · 🟡 no change for 10.5 days · 🔴 no change for 14 days |
| Custom | Set your own Amber and Red thresholds in days — same traffic-light logic, your numbers |
| Manual | No automatic calculation — project health is set manually by the project owner at any time |
In Automatic/Custom mode, the colour is picked in priority order:
- Manual override (temporary) — if someone manually sets green/amber/red, that choice holds, but it still ages into amber then red on the same thresholds unless cleared.
- Task activity in the current phase (preferred signal) — overdue incomplete tasks block green; recent task movement keeps it green or amber; a long quiet spell turns it red.
- Fallback: time in current phase — used only when there’s no useful task-activity signal, based on how long the project has sat in its current phase (or since creation, if phase history is missing).
Moving to a new phase always resets the clock toward green.
⚠️ Automatic health tracks staleness, not strategic success — a project can show green simply because it recently moved phase or had a task updated, whatever the underlying difficulty of the work or its outcome. Full detail, including exactly what triggers each colour change: Settings → Projects → Health Status.
Pain Point AI & scoring
Every pain point gets an AI-assisted write-up and a transparent score — not a grade of how well it’s written or how important the topic is, only a check of whether the text answers the guiding questions behind each field.
- Field score = questions answered ÷ questions asked. 1 of 2 = 50, 2 of 3 = 67, an empty field = 0.
- Overall score = the average of the fields your organization has switched on (unscored fields, like Additional Information, never count toward that average).
- Renaming a field does nothing to the score. Changing its guiding questions, or the text in it, does.
The Pain Point screenshot above shows this in practice: this project renamed the default Current Challenge field to Problem Statement, and scores 9/10 overall — the average of Problem Statement (10), Expected Outcomes (10), Business Impact Potential (10), Implementation Readiness (5), and Strategic Benefits (10); Additional Information’s fixed 0 isn’t counted.
Full field-by-field guiding questions, required fields, custom fields, and exactly what renaming vs. changing questions vs. hiding a field does to the score: Settings → Projects → Pain Point AI.